

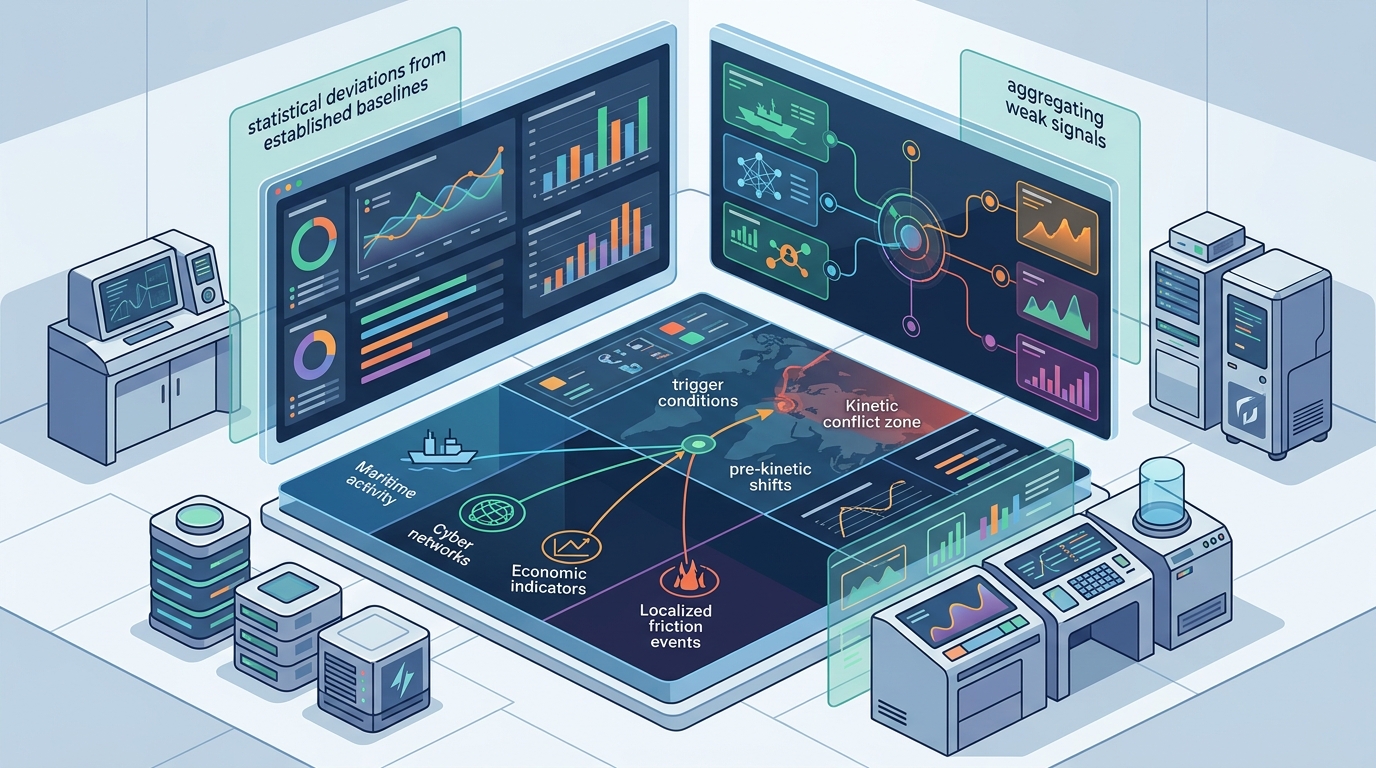
Analysts forecast gray-zone escalation by detecting statistical deviations from established baselines, aggregating weak signals across disconnected domains, and mapping specific trigger conditions that convert friction into kinetic conflict. This guide outlines the eight core methodological pillars required to identify these pre-kinetic shifts. It covers baseline monitoring, competing hypotheses, trigger identification, signal aggregation, and the data fusion tools that power modern convergence intelligence. For additional details, review the COSINT CRUCIBEL.
Baseline Deviation Monitoring
Effective forecasting begins with the establishment of a rigorous operational baseline. A baseline is the statistical norm of activity within a specific domain, such as maritime traffic, diplomatic rhetoric, or energy flow. Without a precise baseline, deviation is indistinguishable from noise. Analysts must define the expected range of variance for each metric before they can identify a meaningful shift. This process requires continuous data collection and the removal of seasonal or cyclical artifacts that might mimic a threat.
Defining the Operational Norm
The operational norm is not a static average. It is a dynamic envelope that accounts for historical trends and known periodicities. For example, a 5% increase in shipping traffic through a strategic strait might be normal during a specific quarter but anomalous during a different period. Analysts must segment data by time, geography, and actor to create granular baselines. This segmentation prevents the dilution of critical signals by broader, less relevant data streams.
Automated Deviation Detection
Manual review of thousands of data points is impossible. Automated systems must flag deviations that exceed a predefined statistical threshold. These systems use nonparametric inferential testing to determine if a deviation is likely due to random chance or a structural change in the system. The goal is to reduce the cognitive load on the analyst, allowing them to focus on interpreting the flagged deviations rather than hunting for them.
Competing Hypotheses Analysis
Observing a deviation does not automatically imply a threat. Analysts must construct and test competing hypotheses to explain the observed change. A competing hypothesis is an alternative explanation for a data anomaly that is mutually exclusive with the primary threat hypothesis. For instance, a sudden increase in military exercises could be a routine training cycle, a response to a third-party threat, or a precursor to aggression. Failing to test these alternatives leads to false positives and erodes the credibility of the analytical product.
The Discipline of Falsification
Probabilistic Weighting
Each hypothesis must be assigned a probability based on the available evidence. These probabilities are not static; they update as new data arrives. The analyst's role is to manage this probabilistic landscape, ensuring that the most likely explanation is clearly identified and that the uncertainty surrounding that identification is transparently communicated to the decision-maker.
Escalation Trigger Identification
Gray-zone activities often remain below the threshold for open conflict for extended periods. The transition to crisis is usually precipitated by a specific trigger event. A trigger is a discrete action or condition that removes the political or strategic cost of further escalation. Identifying these triggers is critical because they are often the only point at which intervention can still prevent a full-scale crisis. Triggers can be accidental, such as a collision, or deliberate, such as a specific diplomatic ultimatum.
Mapping the Escalation Ladder
Analysts must map the specific escalation ladder relevant to the conflict in question. This ladder identifies the sequence of actions that lead from the status quo to kinetic war. Each rung of the ladder represents a point of no return or a significant increase in risk. By mapping this ladder, analysts can identify which current activities are moving the actors up the ladder and which triggers are most likely to be pulled next.
Forcing Conditions
Some triggers are not actions but forcing conditions. A forcing condition is a structural constraint that makes inaction more costly than action. For example, a critical resource shortage can force a state to act to secure supply lines. Identifying these forcing conditions allows analysts to forecast escalation based on structural pressures rather than just observed behavior.
Weak Signal Aggregation
Most gray-zone indicators are weak signals. A weak signal is a data point that is ambiguous, low-confidence, or easily dismissed when viewed in isolation. No single weak signal is sufficient to predict a crisis. However, when multiple weak signals from different domains align, they form a strong pattern. This is the core principle of convergence intelligence. The aggregation of these signals is what allows analysts to see the whole system rather than just its parts.
Cross-Domain Correlation
Weak signals often appear in domains that are not traditionally associated with security. For example, a change in the price of a specific mineral, a shift in academic hiring patterns, and a modification in shipping routes might all be weak signals. Individually, they are noise. Together, they indicate a coordinated effort to secure supply chains for a specific capability. Cross-domain correlation is the method by which these disparate signals are linked.
Signal-to-Noise Ratio
The challenge in aggregation is maintaining a high signal-to-noise ratio. As more data is added, the noise increases. Analysts must use statistical methods to determine which combinations of signals are statistically significant. This requires a deep understanding of the causal relationships between different domains. Without this understanding, aggregation becomes a exercise in finding patterns that do not exist.
Baseline Deviation Analysis
While baseline deviation monitoring is the detection phase, baseline deviation analysis is the interpretation phase. This section focuses on the statistical rigor required to validate a deviation. A deviation is only meaningful if it is statistically significant. Analysts must calculate the probability that the observed deviation occurred by chance. This is done using inferential statistics, which allow for the testing of hypotheses against the baseline data.
Nonparametric Testing
Many real-world data sets do not follow a normal distribution. Parametric tests, which assume normality, can produce misleading results. Nonparametric testing is a statistical method that does not assume a specific distribution for the data. It is more robust for the messy, real-world data that characterizes open-source intelligence. By using nonparametric tests, analysts can ensure that their deviation flags are reliable and not artifacts of statistical assumption.
Temporal Dynamics
The timing of a deviation is as important as its magnitude. A small deviation that occurs rapidly is often more significant than a large deviation that occurs slowly. Analysts must analyze the temporal dynamics of the deviation. This includes looking at the rate of change, the duration of the deviation, and the relationship between the deviation and other events in time.
Escalation Pathways
Escalation is rarely a linear process. It follows complex pathways that can branch, loop, or reverse. An escalation pathway is a sequence of actions and reactions that leads from a stable state to a more unstable one. Mapping these pathways allows analysts to anticipate the likely next steps in a conflict. It also helps in identifying potential off-ramps, where the conflict can be de-escalated before it becomes irreversible.
Branching Scenarios
At each stage of the escalation pathway, there are multiple possible branches. Analysts must model these branches and assign probabilities to each. This creates a decision tree that shows the most likely trajectories of the conflict. By modeling these branches, analysts can prepare for multiple outcomes rather than betting on a single prediction. This is essential for robust strategic planning.
Feedback Loops
Escalation pathways often contain feedback loops. A feedback loop is a process where the output of a system is fed back into the system as input, amplifying or dampening the effect. In conflict, a small action can trigger a response that leads to a larger action, which triggers a larger response. Identifying these loops is critical because they can cause rapid, non-linear escalation. Analysts must look for these loops in the data and model their potential impact.
Intent Attribution
Understanding what an actor is doing is only half the battle. The other half is understanding why they are doing it. Intent attribution is the process of inferring the strategic goals and motivations behind an actor's actions. This is one of the most difficult aspects of gray-zone analysis because intent is rarely stated explicitly. Analysts must infer intent from behavior, context, and historical patterns. This requires a deep understanding of the actor's strategic culture and political constraints.
Behavioral Inference
Intent is inferred from behavior. Analysts look for patterns in the actor's actions that are consistent with a specific strategic goal. For example, a series of cyber attacks on critical infrastructure might indicate an intent to disrupt economic activity. However, the same behavior could also indicate a test of capabilities or a response to a perceived threat. The context in which the behavior occurs is crucial for accurate attribution.
Strategic Culture
Strategic culture is the set of beliefs, values, and norms that shape a state's approach to security. Understanding the strategic culture of an actor helps in interpreting their actions. For example, a state with a strategic culture that emphasizes deterrence through denial will behave differently than a state that emphasizes deterrence through punishment. Analysts must account for these cultural differences when attributing intent.
Data Fusion Tools
The volume and variety of data available to modern analysts require sophisticated data fusion tools. Data fusion is the process of combining data from multiple sources to produce a more accurate and complete picture than any single source could provide. These tools automate the collection, cleaning, and correlation of data. They allow analysts to process data at a scale that is impossible manually. The quality of the data fusion tools directly impacts the quality of the analysis.
Automated Collection and Processing
Modern data fusion tools use automated systems to collect data from a wide range of sources. These sources include news media, social media, government reports, and sensor data. The tools then clean and normalize this data, making it ready for analysis. This automation is essential for keeping up with the pace of information in the modern world. It also reduces the risk of human error in data handling.
Convergence Analysis Engines
At the heart of advanced data fusion is the convergence analysis engine. This engine applies statistical and mathematical models to the fused data to identify patterns of convergence. It tests whether the observed convergence is real or coincidence. The engine's output is a set of flagged convergence events that the analyst can then investigate. This is the technological backbone of convergence intelligence.
Key Takeaways
- Baseline deviation monitoring is the foundation of gray-zone forecasting, requiring dynamic and granular statistical norms.
- Competing hypotheses analysis prevents confirmation bias by actively testing alternative explanations for observed anomalies.
- Escalation triggers are discrete events or forcing conditions that remove the cost of further conflict, and must be mapped in advance.
- Weak signals are ambiguous data points that only become significant when aggregated across multiple disconnected domains.
- Nonparametric statistical testing is essential for validating deviations in messy, real-world open-source data.
- Escalation pathways are non-linear and often contain feedback loops that can cause rapid, unpredictable shifts in conflict intensity.
- Intent attribution requires inferring strategic goals from behavior and understanding the actor's strategic culture.
- Automated data fusion tools are necessary to process the volume of data required for cross-domain convergence analysis.
Frequently Asked Questions
What is the difference between a weak signal and a strong signal?
A weak signal is a data point that is ambiguous or low-confidence when viewed in isolation. A strong signal is a data point that is clear and high-confidence. In gray-zone analysis, strong signals are rare. Most indicators are weak signals that only become strong when aggregated with other signals from different domains.
How do analysts avoid confirmation bias in gray-zone analysis?
Analysts avoid confirmation bias by constructing and testing competing hypotheses. They must actively seek evidence that disproves their primary hypothesis. This discipline of falsification ensures that the analysis is driven by the data rather than by pre-existing beliefs.
What is a forcing condition in the context of escalation?
A forcing condition is a structural constraint that makes inaction more costly than action. It is not an action itself, but a pressure that pushes an actor toward a specific course of action. Examples include resource shortages, political deadlines, or strategic vulnerabilities.
Why is cross-domain correlation important for forecasting?
Cross-domain correlation is important because gray-zone activities often span multiple domains. No single domain provides a complete picture. By correlating data from different domains, analysts can identify patterns that are invisible within any single domain. This is the core of convergence intelligence.
What role do statistical models play in data fusion?
Statistical models are used to determine whether observed patterns in the fused data are statistically significant. They help distinguish between real convergence and random coincidence. This is essential for reducing false positives and ensuring the reliability of the analysis.
How does strategic culture influence intent attribution?
Strategic culture shapes how a state perceives threats and how it responds to them. Understanding the strategic culture of an actor helps analysts interpret their actions more accurately. It provides context for why an actor might choose a specific course of action in a given situation.
Conclusion
Forecasting gray-zone escalation is a complex discipline that requires a combination of statistical rigor, strategic understanding, and advanced data fusion tools. It is not about predicting the future with certainty. It is about reducing uncertainty and identifying the conditions under which a crisis is most likely to occur. By mastering the eight pillars outlined in this guide, analysts can provide decision-makers with the insights they need to navigate the complex landscape of modern conflict. CRUCIBEL Journal continues to apply these methodologies to the most critical geopolitical and market challenges of our time, providing independent, rigorously graded analysis that stands on its own record.